
In a new study, CareerBuilder explored employment trends for the 100 most populous U.S. cities and compiled a list of the top fastest-aging cities. The list is based on the percentage of a given city’s workforce made up of workers ages 55+ and how much that percentage – or “share” – has grown since 2001.
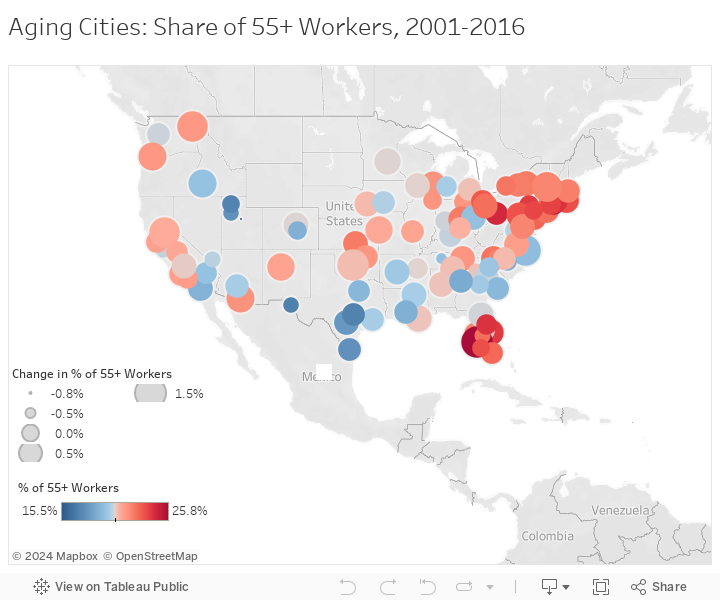
For a clearer picture of the changing age of the workforce, CareerBuilder translated this list into an interactive map, which visualizes two key statistics. For each city, the darker the red, the larger the share of 55+ workers, and the bigger the circle, the greater increase in share of older workers over the past 15 years.
Fastest-aging cities
North Port, FL
- Share of workers ages 55+ in 2016: 25.8 percent
- Change in share of workers ages 55+ (2001 to 2016): 1.5 percent
Oklahoma City, OK
- Share of workers ages 55+ in 2016: 21 percent
- Change in share of workers ages 55+ (2001 to 2016): 1.5 percent
Virginia Beach, NC
- Share of workers ages 55+ in 2016: 19.5 percent
- Change in share of workers ages 55+ (2001 to 2016): 1.3 percent
Sacramento, CA
- Share of workers ages 55+ in 2016: 21.7 percent
- Change in share of workers ages 55+ (2001 to 2016): 1.3 percent
Spokane, WA
- Share of workers ages 55+ in 2016: 21.7 percent
- Change in share of workers ages 55+ (2001 to 2016): 1.3 percent
Of course, while overall the workforce is aging, there are some cities where an influx of younger workers has reversed that trend. These are the cities where the share of workers ages 22 to 34 has increased since 2001:
Increasingly youthful cities
Madison, WI
- Share of workers ages 22-34 in 2016: 30.3 percent
- Change in share of workers ages 22-34 (2001 to 2016): 3.1 percent
El Paso, TX
- Share of workers ages 22-34 in 2016: 32.3 percent
- Change in share of workers ages 22-34 (2001 to 2016): 2.1 percent
Colorado Springs, CO
- Share of workers ages 22-34 in 2016: 31.6 percent
- Change in share of workers ages 22-34 (2001 to 2016): 2 percent
Allentown, PA
- Share of workers ages 22-34 in 2016: 26.2 percent
- Change in share of workers ages 22-34 (2001 to 2016): 1.7 percent
Austin, TX
- Share of workers ages 22-34 in 2016: 32.3 percent
- Change in share of workers ages 22-34 (2001 to 2016): 1.6 percent


